 It’s taken some time to pull together the data, but I’ve now got a complete set of booth-level data from the 2012 and 2016 local council elections.
The most interesting stat from the elections is that turnout dropped across almost all councils which held elections in September 2016, with turnout dropping the most in metropolitan NSW.
For the purpose of analysis, I have analysed 76 councils which held contested elections in both 2012 and 2016, plus Tweed council, which held a delayed election at the end of October. I excluded the results in Cobar, Leeton, Narrandera and Warren councils, as well as certain wards of Greater Hume and Lockhart, all of which held uncontested elections in 2012, thus making it impossible to make a comparison of voting data.
Out of those 76 councils, turnout dropped in 74. Turnout increased in Balranald council, in the far south-west, and in the City of Sydney. The increase was small in both cases.
It turns out that turnout dropped in 75 out of 76 councils – unfortunately I made an error in calculating the total turnout in the City of Sydney, as there was a big change between the full enrolment and the numbers in a similar dataset. Balranald is the only council which increased turnout.
Turnout increased by 5.6% in Tweed when the election was held at the end of October, almost two months after the rest of the election was held.
The drop in turnout was significantly worse in metropolitan NSW (including the Sydney region and the lower Hunter). Those metropolitan councils make up 58% of those enrolled to vote in the recent elections. While turnout dropped by 2.4% in regional areas, the drop was well over 4% in metropolitan councils.
| Party | Formal | Informal | Enrolment | Turnout (%) | Turnout change |
| Metro | 1,027,275 | 74,776 | 1,409,743 | 79.46 | -4.35 |
| Regional | 741,698 | 52,610 | 989,071 | 80.32 | -2.43 |
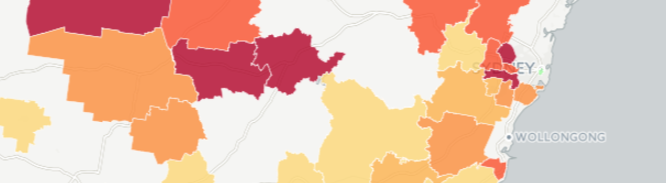
This map shows turnout for each council, and shows a more nuanced picture. Turnout was particularly poor in western NSW, dropping by over 8% in Wedding and over 11% in Bourke. Turnout also dropped by over 9% in the City of Sydney, almost 8% in the City of Blacktown and by 6.5% in Liverpool.
So why did turnout drop? I can think of two possibilities. Firstly, the election was held within months of a federal election, whereas no election had been held closer than 18 months before the 2012 council election. This could explain why Tweed, which was delayed by more than a month, had a higher turnout.
I find it more plausible that turnout was hit by confusion due to only some councils holding elections. Particularly if you live in Sydney or the lower Hunter, communities, media markets and social networks stretch over numerous councils. Friends and colleagues would not have had elections, breeding confusion about whether any individual voter was required to vote. I heard this confusion myself from family members in Campbelltown and Blacktown councils.
This would explain why turnout dropped more severely in councils in western Sydney than in regional areas, where communities fit more neatly within council boundaries.
I’ve used the same dataset to calculate the vote and seat numbers for each party. Since most non-metropolitan councils are dominated by independents, I’ve split the vote up to give a better picture of the partisan split in the metropolitan half of the state where parties are much more prominent.
The election was a good one for Labor, who increased their vote by 9% in metro areas, mostly at the expense of independents and small parties. The Liberal vote increased slightly, and the Greens vote dropped slightly. We saw similar trends in the number of councillors.
Outside of metro NSW, Labor tne the Greens both had increases in their vote and seat numbers, but the vast majority still cast votes for independents.
Metro councils
| Party | Votes | % | Swing (%) | Seats | Seat change |
| Labor | 384,637 | 37.9 | 9.1 | 64 | 18 |
| Liberal | 276,992 | 27.3 | 0.6 | 47 | 0 |
| Independents/Others | 275,060 | 27.1 | -9.3 | 42 | -15 |
| Greens | 54,939 | 5.4 | -0.3 | 4 | -1 |
| Christian Democratic | 15,326 | 1.5 | 0.3 | 0 | 0 |
| Liberal Democrats | 4,356 | 0.4 | 0.1 | 0 | -1 |
| Australia First | 2,948 | 0.3 | -0.4 | 0 | -1 |
Regional councils
| Party | Votes | % | Swing (%) | Seats | Seat change |
| Independent/Others | 624,954 | 84.3 | -3.5 | 491 | -17 |
| Greens | 59,694 | 8.0 | 1.9 | 21 | 7 |
| Labor | 49,225 | 6.6 | 2.2 | 18 | 7 |
| Liberal | 7,825 | 1.1 | -0.6 | 1 | -3 |
So you might ask, what is this dataset which allowed you to complete this dataset? I’ve recently been working on a project to take the inaccessible data for state and local elections (particularly at the booth level), clean it up and put it in a standard format to make it easy to use. I’ve now done this for a handful of elections, and they are all available in the new Tally Room data repository. Enjoy!